
Walkability is the degree to which a built environment supports and encourages travel on foot, measured by both the physical infrastructure present and how safe, comfortable, and connected pedestrians actually feel moving through it. This guide covers walkability as a dual concept: objective, measurable features like sidewalk coverage and intersection density, and subjective perception, meaning whether a street actually feels worth walking. Tools like Walk Score and the EPA's National Walkability Index anchor the measurement side, while the emerging framework of Active Living Environments broadens the concept to include cycling, transit, and social spaces.
Table of Contents
- What does "walkability" actually mean?
- What are the core components of a walkable place?
- How is walkability measured, and what do the tools miss?
- Why does walkability matter? Health, environment, and economic benefits
- What interventions actually improve walkability?
- What real-world examples show about walkability in practice
- Why walkability matters to homebuyers and how to evaluate it locally
- What are the main critiques and trade-offs of walkability?
- Key Takeaways
- Walkability through the lens of a San Diego real estate agent
- Useful sources and further reading
What does "walkability" actually mean?
The word "walkability" entered mainstream planning vocabulary in the 1990s alongside the New Urbanism movement, which pushed back against car-centric suburban sprawl by advocating for mixed-use, human-scale neighborhoods. Before that, the idea existed in practice, in Jane Jacobs's arguments for dense, mixed streets in The Death and Life of Great American Cities (1961), but it lacked a single term.
The core tension in every definition since then is the same: objective infrastructure versus subjective experience. A street can have wide sidewalks, crosswalks at every corner, and a grocery store within a quarter mile, yet still feel hostile to walk because of fast traffic, poor lighting, or blank building facades. Conversely, a narrow street with minimal formal infrastructure can feel highly walkable if it is slow, shaded, and lined with active storefronts.
Researchers writing in BMC Public Health have documented that the academic community lacks a single agreed-upon definition of walkability. That is not a flaw in the research; it reflects the genuine complexity of what makes a place pedestrian-friendly. In response, many scholars now prefer the term Active Living Environments (ALEs), which deliberately expands the frame to include cycling infrastructure, transit access, and social spaces alongside walking conditions. The shift matters because it pushes planners to think about long-term livability rather than just sidewalk coverage.
The EPA's National Walkability Index takes a practical stance: walkable communities improve public health, reduce vehicle emissions, and conserve resources, while acknowledging that what "walkable" looks like varies significantly by region, density, and climate. That context-dependence is why a single national score can only go so far.
Key reasons definitions vary:
- Scale: A block can be highly walkable while the surrounding neighborhood is not.
- User group: A 30-year-old commuter and a 70-year-old retiree experience the same street very differently.
- Purpose: Walking to transit, walking for exercise, and walking to a café involve different route choices and tolerances.
- Perception: Urban design research consistently shows that perceived safety and comfort can override objectively good infrastructure.
What are the core components of a walkable place?
Two frameworks dominate the planning literature, and they complement rather than compete with each other.
The 5 Ds
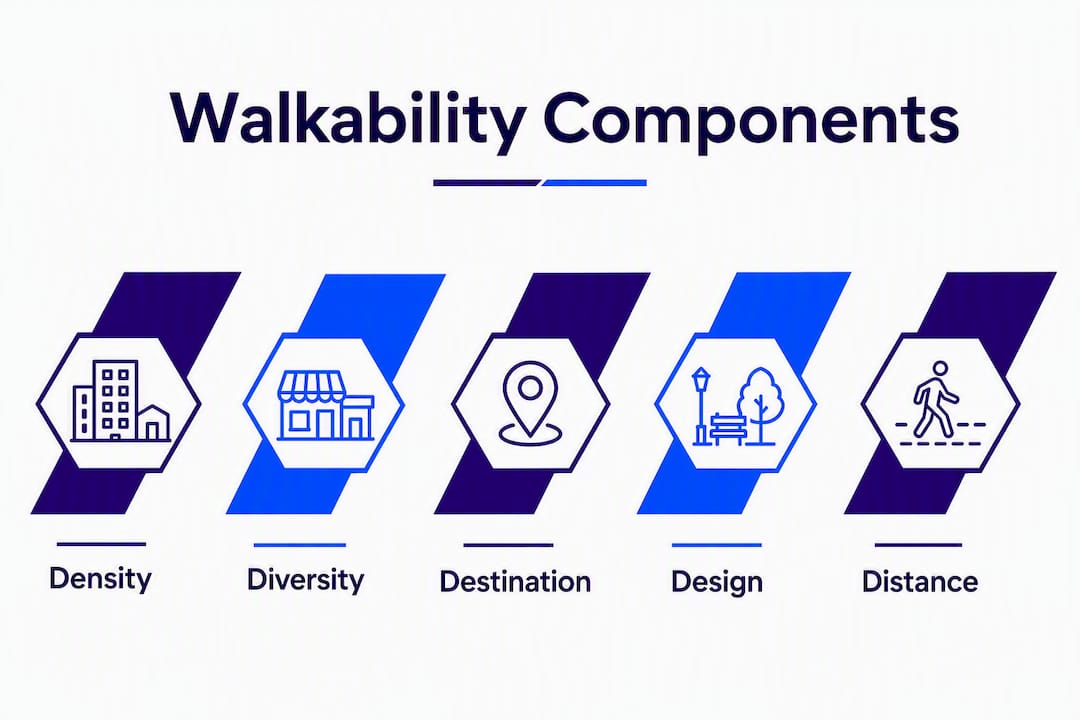
Developed by urban planning researchers and widely cited in transportation and land-use studies, the 5 Ds describe neighborhood-scale conditions:
- Density: Higher residential and employment density puts more destinations within walking distance. A neighborhood with 20 units per acre generates far more foot traffic than one with 4.
- Diversity: Mixed land uses, housing types, and income levels mean residents can accomplish more errands on foot. A block with housing above retail is more walkable than a single-use residential street.
- Design: Street connectivity, block length, sidewalk width, and intersection geometry all shape how easy it is to walk from point A to point B. Short blocks with frequent intersections consistently outperform superblocks.
- Destination accessibility: How close are jobs, schools, parks, and transit stops? Distance to a grocery store is one of the most commonly used single-variable proxies for walkability.
- Distance to transit: Transit access multiplies walkability by extending the range of trips a pedestrian can complete without a car.
The 4 pillars
An alternative framing used by planners and public-health researchers organizes walkability around the pedestrian's experience rather than the neighborhood's form:
- Reason to walk: Are destinations close enough and varied enough to make walking the logical choice?
- Safety: Are crossings protected? Is traffic calmed? Is the area free from crime risk?
- Comfort: Are there shade trees, benches, shelter from weather, and level surfaces?
- Interest: Does the street engage the senses? Human-scale storefronts, varied facades, and public art all raise the probability that someone will walk rather than drive.
These four pillars map directly onto the 5 Ds: "reason to walk" corresponds to density, diversity, and destination accessibility; "safety" and "comfort" correspond to design; "interest" is the subjective layer the 5 Ds underweight.
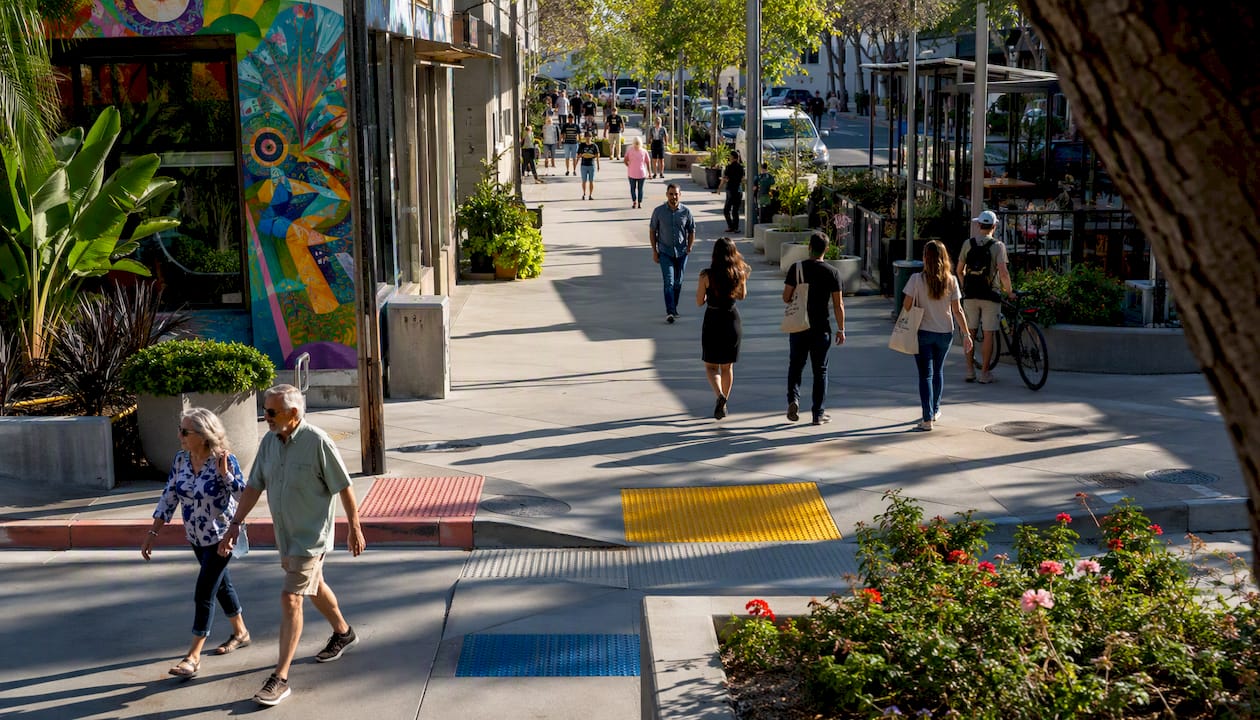
At the street level, the features that consistently appear in walkable places include continuous sidewalks with adequate width suitable for comfortable pedestrian use in residential areas, marked crosswalks with pedestrian signals, street trees providing shade and a buffer from traffic, active ground-floor uses (storefronts, lobbies, windows), human-scale lighting at 10–15 foot mounting heights, and short block lengths that keep intersections frequent.
Pro Tip: When assessing a block's "imageability," stand at one end and ask whether you can see an active destination from where you stand. If the view terminates in a blank wall, a parking lot, or a fast-moving arterial, the block will feel unwalkable regardless of what the sidewalk looks like underfoot.
How is walkability measured, and what do the tools miss?
No single tool captures the full picture. The most useful approach combines at least two measures: one objective, one perceived.

Walk Score
Walk Score assigns every U.S. address a score from 0 to 100 based primarily on proximity to amenities: restaurants, grocery stores, schools, parks, and transit stops. It is fast, free, and widely used by homebuyers and real estate agents. Its strength is destination access. Its weakness is that it says nothing about sidewalk quality, lighting, perceived safety, or the actual comfort of the walking route. A high Walk Score address next to a six-lane arterial with no crosswalks is a common example of where the tool misleads.
EPA National Walkability Index
The EPA's National Walkability Index ranks every Census block group in the United States on a scale of 1 to 20. It incorporates intersection density, proximity to transit, and employment mix, making it more structurally rigorous than Walk Score. It is designed for planners and researchers rather than consumers, and it still operates at the block-group level, which can mask significant variation within a neighborhood.
GIS and objective metrics
Researchers and planners using geographic information systems (GIS) typically measure:
- Intersection density: Intersections per square mile. Higher density means shorter blocks and more route options.
- Block length: Shorter blocks correlate with higher pedestrian activity.
- Land-use mix: Entropy indices that quantify how evenly different uses (residential, retail, office, civic) are distributed.
- Distance to transit: Straight-line or network distance to the nearest bus stop or rail station.
These objective GIS metrics are reproducible and comparable across cities, but they miss everything subjective: whether the sidewalk feels safe at night, whether the street trees actually provide shade, or whether the storefronts are active or shuttered.
Perceived and survey measures
Short walkability audits, like the Pedestrian Environment Data Scan (PEDS) or the Irvine-Minnesota Inventory (IMI), ask trained observers or residents to rate specific block features. These tools capture comfort, maintenance, and perceived safety, but they are time-intensive and harder to scale.
| Tool | Measurement approach | Primary strength | What it misses |
|---|---|---|---|
| Walk Score | Destination proximity algorithm | Fast, consumer-friendly | Sidewalk quality, safety, comfort |
| EPA National Walkability Index | Intersection density, transit, land-use mix | Rigorous, national coverage | Block-level variation, perception |
| GIS metrics (intersection density, block length) | Spatial analysis of built form | Reproducible, comparable | Subjective experience |
| Perceived audits (PEDS, IMI) | Observer or resident ratings | Captures comfort and safety | Labor-intensive, not scalable |
Best-practice guidance consistently recommends combining Walk Score or GIS metrics with a short on-the-ground audit or perceived-walkability survey. Neither alone produces a reliable picture of whether people will actually walk.
Why does walkability matter? Health, environment, and economic benefits
The case for walkability is not abstract. It shows up in health data, emissions records, and property appraisals.
Public health
EPA guidance and peer-reviewed studies document consistent associations between walkable environments and higher rates of physical activity, with downstream reductions in population-level risk of obesity, type 2 diabetes, cardiovascular disease, and some mental health conditions. The mechanism is straightforward: when walking is convenient and pleasant, people do more of it without thinking of it as exercise.
Environmental benefits
Walkable places reduce vehicle miles traveled (VMT). Fewer VMT means lower tailpipe emissions, less pavement, smaller stormwater runoff loads, and reduced demand for surface parking. The EPA frames walkability explicitly as a resource-conservation strategy, not just a health intervention.
Social and mental health benefits
Streets with pedestrian activity generate informal social interaction. Neighbors who walk the same routes recognize each other; local businesses become gathering points. Research in urban design links active street life to reduced social isolation and improved mental health outcomes, particularly for older adults.
Economic benefits
The economic case is well-documented:
- Walkable neighborhoods tend to command higher residential property values, because buyers pay a premium for the convenience of reaching daily needs on foot.
- Local retail benefits from foot traffic in ways that car-dependent strip malls cannot replicate.
- Reduced household transportation costs (fewer car trips, lower fuel and maintenance spending) effectively increase disposable income for residents.
One important caveat: effect sizes vary considerably by context. A walkability improvement in a dense urban core produces different outcomes than the same intervention in a low-density suburb. Studies that pool results across contexts can overstate benefits for any specific location.
What interventions actually improve walkability?
Improving walkability works at three scales, and the most effective programs address all three simultaneously.
Spot improvements (block level)
These are the fastest and least expensive changes:
- Curb ramps and ADA-compliant crossings: Required by federal law at new construction and retrofits; often the single highest-impact fix on a dangerous block.
- Marked crosswalks with high-visibility striping: Reduces pedestrian-vehicle conflicts at unsignalized intersections.
- Pedestrian-scale lighting: Improves perceived safety at night without requiring street reconstruction.
- Bulb-outs (curb extensions): Shorten the crossing distance and slow turning vehicles; can be installed with paint and flexible delineators as a low-cost pilot.
Street-level improvements
- Continuous sidewalk networks with a minimum clear width of 5 feet, separated from traffic by a planting strip or parked cars.
- Street trees planted at regular intervals to provide shade, reduce heat island effects, and create a physical buffer between pedestrians and moving vehicles.
- Traffic calming measures: speed tables, raised intersections, and chicanes that reduce vehicle speeds to 20 mph or below on residential streets.
Neighborhood-scale policy
Planning literature and EPA guidance point to mixed-use zoning, transit investment, and complete-streets policies as the highest-leverage interventions. Mixed-use zoning creates the density and diversity that make walking logical. Transit investment extends the range of car-free trips. Complete-streets ordinances require that every road project consider pedestrians, cyclists, and transit users alongside drivers.
Community groups can influence change by attending city planning commission meetings, participating in environmental impact reviews, and advocating for pedestrian safety improvements through local transportation agencies. Individual homeowners can plant street trees (where permitted), maintain sidewalks in front of their properties, and support local businesses that activate ground floors.
Pro Tip: When advocating for a walkability improvement, lead with safety data rather than aesthetics. Pedestrian crash data from your city's Vision Zero report or state DOT is far more persuasive to a city council than a request for "a nicer streetscape."
What real-world examples show about walkability in practice
Three brief cases illustrate how walkability plays out differently depending on scale, context, and what is being measured.
-
New York City's High Line (Manhattan): Converting an elevated freight rail line into a linear park dramatically increased foot traffic in the surrounding West Chelsea neighborhood. Property values rose sharply within a few blocks. The lesson: a single infrastructure investment can shift an area's walkability perception faster than years of incremental sidewalk repair. The trade-off was significant: rents rose, and longtime residents and small businesses were displaced.
-
Minneapolis's street grid: Minneapolis has one of the most connected street grids in the United States, with short blocks and high intersection density. Its Walk Score and EPA National Walkability Index rankings consistently reflect this. Yet in winter, perceived walkability drops sharply because snow and ice make the same infrastructure hostile. Objective scores do not capture seasonal variation.
-
San Diego's North Park neighborhood: North Park's mix of bungalow-era housing, walkable retail on 30th Street, and proximity to Balboa Park produces strong walkability scores. Buyers evaluating North Park consistently cite the ability to walk to coffee, restaurants, and the park as a primary draw. The neighborhood illustrates how historic street grids, built before car-centric zoning, often outperform newer suburban development on every walkability metric.
Why walkability matters to homebuyers and how to evaluate it locally
For buyers, walkability is not just a lifestyle preference. It is a financial variable. Walkable neighborhoods in San Diego tend to hold value more reliably in soft markets because the pool of buyers who want them stays deep. Mission Hills and Hillcrest, for example, consistently attract buyers willing to pay a premium for the ability to walk to restaurants, transit, and parks.
A Walk Score alone is not enough for a purchase decision. Here is what to check on the ground:
- Sidewalk continuity: Walk the route from the front door to the nearest grocery store or transit stop. Are there gaps, broken pavement, or sections where you would have to walk in the street?
- Crossing quality: Count the marked crosswalks on the block. Are pedestrian signals present? Are crossing distances reasonable?
- Traffic speed and volume: Stand on the sidewalk for five minutes. Do passing vehicles feel threatening? Speed matters more than volume for perceived safety.
- Ground-floor activation: Are the buildings along the route occupied and active? Blank walls and shuttered storefronts kill the experience even when the infrastructure is intact.
- Shade and comfort: In San Diego's climate, shade trees are not decorative. A shadeless half-mile walk in July is a deterrent regardless of destination proximity.
- Evening conditions: Return after dark. Lighting quality and activity levels at night often differ dramatically from midday conditions.
Pro Tip: Ask your agent to walk the block with you at two different times: once on a weekday morning and once on a weekend afternoon. The difference in foot traffic, noise, and street activity will tell you more about day-to-day walkability than any score.
Jeffsellssandiego evaluates walkability as part of every buyer consultation, looking at block-level conditions rather than neighborhood averages, because block conditions are what buyers actually live with. If you want to search walkable San Diego neighborhoods by specific criteria, that is the right starting point.
What are the main critiques and trade-offs of walkability?
Walkability improvements are not universally positive, and the planning community has documented several recurring problems.
Gentrification and displacement: This is the most serious critique. Research on walkability drivers documents that improving walkability raises property values, which raises rents, which displaces lower-income residents who benefited from the neighborhood's affordability. The people most likely to be priced out are often those who most depend on walkable access to daily needs because they do not own cars.
One-size-fits-all design: Standard walkability interventions are designed around an able-bodied adult of working age. Older adults, people with mobility impairments, parents with strollers, and children have different needs that generic "pedestrian-friendly" design often fails to address.
Climate and seasonal variation: Walkability scores are static, but walking conditions are not. Extreme heat, heavy rain, and in northern cities, snow and ice, can make highly rated infrastructure genuinely hostile for months at a time.
Differing perceptions across groups:
- Women and older adults consistently rate the same streets as less safe than men and younger adults do, even when objective crime data is identical.
- People with disabilities often find that technically compliant ADA infrastructure still fails in practice (broken ramps, blocked curb cuts, uneven surfaces).
- Cultural factors shape route preferences and comfort levels in ways that aggregate scores cannot capture.
Policy mitigation strategies:
- Pair walkability investments with inclusionary zoning requirements and tenant protections to limit displacement.
- Use community land trusts to preserve affordable housing in areas targeted for walkability improvements.
- Conduct equity-focused engagement processes that center the voices of current low-income residents before finalizing improvement plans.
- Phase improvements to allow monitoring of displacement pressure before committing to full buildout.
Key Takeaways
Walkability is most useful as a multi-layered concept: objective infrastructure sets the floor, but perceived safety and comfort determine whether people actually walk.
| Point | Details |
|---|---|
| No single definition exists | Researchers favor "Active Living Environments" to capture walking, cycling, transit, and social factors together. |
| Use multiple measurement tools | Combine Walk Score with a block-level audit; neither alone gives a reliable picture of pedestrian experience. |
| Health and economic benefits are real | Walkable neighborhoods are linked to higher physical activity, lower chronic disease risk, and stronger property values. |
| Equity must be built in | Walkability improvements raise property values and can displace residents; anti-displacement policies must accompany infrastructure investment. |
| Block conditions beat neighborhood averages | For homebuyers, the specific block matters more than the neighborhood's aggregate score. |
Walkability through the lens of a San Diego real estate agent
The gap between a neighborhood's walkability score and what a buyer actually experiences on a specific block is where most purchase decisions go wrong. Aggregate scores are useful for narrowing a search, but they can mask a single bad block, a missing sidewalk segment, or a crossing that feels genuinely dangerous.
San Diego is an interesting case because its walkability is so uneven. North Park and Mission Hills score well because their pre-war street grids were built for pedestrians. Move a mile east or north into newer suburban development and the same city produces a completely different experience: wide arterials, minimal sidewalks, and destinations that are technically close but practically unreachable on foot. Buyers who rely only on a neighborhood-level score sometimes discover this the hard way after closing.
The most useful thing I can offer buyers evaluating walkability is a 30-minute walk test before making an offer: start at the front door, walk to the nearest grocery store or transit stop, and pay attention to what the route actually feels like. That single exercise surfaces more relevant information than any index. If you have questions about specific San Diego neighborhoods and how walkability factors into pricing and resale, reach out directly.
Useful sources and further reading
These are the primary references behind this article, selected for authority and practical usefulness.
| Resource | What it is best for |
|---|---|
| EPA National Walkability Index: Methodology and User Guide | Understanding how the federal index is built, what it measures, and how to interpret block-group scores for planning or research. |
| Rethinking Walkability and Active Living Environments (BMC Public Health) | The peer-reviewed case for moving beyond "walkability" to Active Living Environments; essential for anyone working on definitions or policy framing. |
| PMC: Active Living Environments and Walkability | Best-practice guidance on combining objective GIS measures with perceived-walkability audits; useful for planners and researchers designing assessments. |
| Ewing et al. — Urban Design Qualities and Walkability (JPAH) | The foundational study on human-scale design qualities (imageability, enclosure, human scale, transparency, complexity) and their relationship to walking behavior. |
| Walkability — Wikipedia | A solid overview of definitions, GIS metrics, and research history; useful as a starting map of the field before going deeper into primary sources. |
| Drivers of Walkability: Implications for Policy (ScienceDirect) | A recent review covering gentrification, displacement, and policy responses; the most current source on equity trade-offs. |
| Walk Score | The fastest consumer tool for a first-pass walkability check on any U.S. address; use alongside a block-level audit, not instead of one. |
| Jeffsellssandiego — San Diego Neighborhood Guide | Local resource for buyers evaluating walkable San Diego neighborhoods by area, with listings and neighborhood-specific context. |