
A home is affordable when your total housing costs stay within a sustainable share of your income without crowding out savings, emergencies, or other obligations. The two rules most people encounter first: HUD defines affordable housing as spending no more than a sustainable share of gross income on housing costs including utilities, and households that exceed that threshold are considered "cost-burdened." Lenders apply a tighter screening rule limiting your monthly PITI (principal, interest, taxes, insurance) and all debt payments combined to sustainable portions of gross monthly income.
Use those two filters as your starting point, then stress-test against your actual budget before you make any offer.
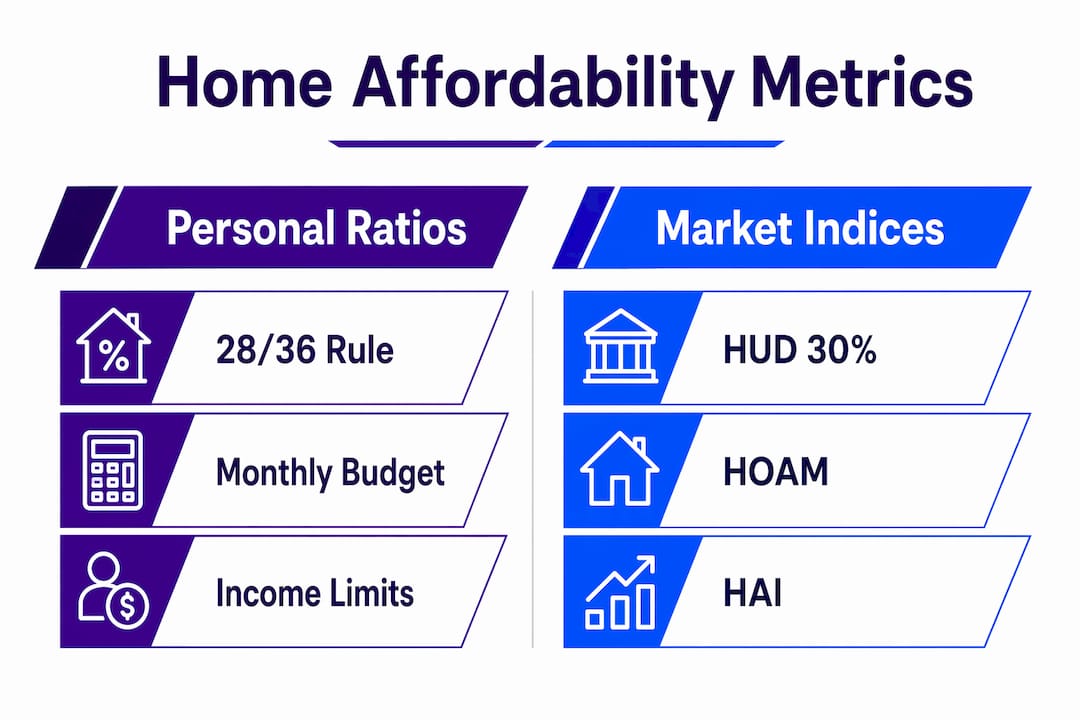
- Policy baseline (HUD 30%): Spending more than 30% of gross income on housing costs signals cost burden, with higher shares indicating severe cost burden.
- Lender front-end: Your monthly PITI payment should stay at or below 28% of gross monthly income for standard mortgage qualification.
- Lender back-end: Add every monthly debt obligation — car loans, student loans, credit cards — and the total should not exceed 36% of gross monthly income.
- Market indices: The National Association of REALTORS® Housing Affordability Index (HAI) and the Atlanta Fed's Home Ownership Affordability Monitor (HOAM) measure whether a median-income household can afford a median-priced home in a given area.
Jeffsellssandiego works with San Diego buyers every day who pass the 28/36 screen on paper but still feel squeezed after closing. The ratio is the entry ticket, not the whole picture.
Table of Contents
- What do the official definitions of home affordability actually mean?
- How do market-level affordability indices work?
- How to calculate your own home affordability
- Why the common rules are only a starting point
- A practical buyer checklist from a San Diego agent
- How your credit score shapes what lenders will offer you
- How fixed-rate vs. adjustable-rate mortgages affect long-term affordability
- Key Takeaways
- The ratio is a floor, not a ceiling
- Useful sources and tools
What do the official definitions of home affordability actually mean?
The 30% rule has been U.S. housing policy's anchor for decades. HUD and advocacy groups use it to classify households: spend more than 30% of gross income on housing and you are cost-burdened; spend more than 50% and you are severely cost-burdened. The threshold applies to owners and renters alike, though what counts as "housing costs" differs by tenure.
For owners, housing costs mean PITI: principal and interest on the mortgage, property taxes, and homeowner's insurance premiums. HOA fees and utilities are often added depending on the context. For renters, housing costs are rent plus utilities. Knowing which components are in the denominator matters when you compare your situation to any published threshold.
The 28/36 rule comes from lender underwriting, not federal policy. Bankrate's breakdown of the standard industry guideline is clear: the front-end ratio (28%) covers PITI only, while the back-end ratio (36%) covers every recurring debt obligation. Exceed the back-end limit and most conventional lenders will either decline the application or require compensating factors to proceed.
One distinction worth holding onto: HUD's 30% standard is a policy and advocacy tool used to measure housing stress across populations. The 28/36 rule is an underwriting tool used to decide whether a specific borrower qualifies for a specific loan. They measure related but different things. Harvard's Joint Center for Housing Studies frames the broader affordability problem as a collision between a "housing problem" (rising prices) and an "income problem" (wages not keeping pace) — a reminder that affordability is shaped by both sides of the equation, not just sticker price.
How do market-level affordability indices work?
Personal affordability ratios tell you whether you can afford a home. Market indices tell you whether the typical household in a given area can afford the typical home there. Both matter, but they answer different questions.

The Atlanta Fed's Home Ownership Affordability Monitor (HOAM) and HUD's Homebuyer Affordability Index share the same logic: an index value at the established breakeven point means a median-income household can just afford a median-priced home while spending no more than the accepted share of income on housing costs. Above 100 means the area is relatively affordable; below 100 means the median household cannot afford the median home at that threshold. The HOAM calculation includes principal, interest, homeowner's insurance, property taxes, and other ownership costs — the full PITI stack, not just the purchase price.
| Measure | Rule type | What it includes | Interpretation threshold | Primary use case |
|---|---|---|---|---|
| HUD 30% rule | Policy baseline | Gross income vs. housing costs (PITI or rent + utilities) | >30% = cost-burdened | Policy analysis, advocacy |
| 28/36 rule | Lender underwriting | PITI (front-end); all debt (back-end) | >28% or >36% = qualification risk | Mortgage pre-qualification |
| NAR Housing Affordability Index | Market index | Median income vs. income needed for median-priced home | 100 = breakeven affordability | Market research, timing |
| Atlanta Fed HOAM | Market index | PITI + ownership costs vs. median income | 100 = breakeven affordability | Geographic comparison |
Use HOAM and the NAR HAI when you are comparing neighborhoods, evaluating market timing, or deciding between two metros. Neither index replaces your personal PITI math.
How to calculate your own home affordability
The arithmetic is straightforward once you know what goes into each number.
- Find your gross monthly income. Divide your annual pre-tax salary by 12. For a $70,000 salary, that is $5,833/month.
- Apply the 28% front-end cap. Multiply gross monthly income by 0.28. At $70,000/year, your maximum monthly PITI is $1,633.
- Estimate PITI components. Use a mortgage calculator to find principal and interest (P&I) for your target loan amount, then add estimated property taxes (commonly 1–1.5% of home value annually, divided by 12) and homeowner's insurance (roughly $100–$200/month for a median-priced home, though this varies significantly by location and coverage).
- Test against the 30% HUD threshold. At $5,833/month, 30% is $1,750. If your PITI lands below both $1,633 (28%) and $1,750 (30%), you clear both screens.
- Check the back-end ratio. Add your car payment, student loans, and minimum credit card payments to your PITI. Divide by gross monthly income. Stay at or below 36%.
- Reverse-calculate a maximum price. Start with your 28% monthly PITI limit, subtract your estimated taxes and insurance, and the remainder is your maximum principal-and-interest payment. Plug that into a mortgage affordability calculator with your interest rate, loan term, and down payment to solve for the maximum loan amount, then add your down payment for the maximum purchase price.
Worked example — $70,000 salary, 7% rate, 10% down, 30-year term:
- Max PITI: $1,633/month (28% of gross monthly income)
- Estimated taxes + insurance: ~$450/month
- Max P&I: ~$1,183/month
- At 7%, that P&I supports roughly a $178,000 loan
- With 10% down: maximum purchase price around $198,000
For a $400,000 home at 7%, the P&I alone runs about $2,661/month. Add taxes and insurance and you are looking at $3,100+ monthly — which requires a gross income of roughly $133,000 to stay under the 28% front-end cap.
Pro Tip: Round your tax and insurance estimates up, not down. A $50/month error in your assumptions compounds over 30 years and can push you past your comfort zone in year two when the tax bill arrives.
Lenders accept compensating factors — a high credit score, substantial cash reserves, or long employment history — to approve loans that slightly exceed the 36% back-end limit. Document those factors before you apply.
Why the common rules are only a starting point
The 28/36 and 30% rules are screening tools. They were never designed to account for the full cost of your life. Industry practitioners note that these ratios exclude childcare, transportation, healthcare, and high-interest consumer debt — costs that can easily consume another 15–20% of take-home pay for a family.
A lower purchase price does not automatically mean a more affordable home. When mortgage rates are elevated or property taxes and insurance are high, the monthly payment on a "discounted" home can rival that of a pricier home bought in a lower-rate environment. Price alone is an incomplete measure of what you will actually pay each month.
Transaction costs add another layer. Closing costs typically run 2–5% of the loan amount. Property tax reassessments after a sale can spike your annual bill. Maintenance — roofs, HVAC, plumbing — tends to average 1–2% of home value per year, though the timing is unpredictable. Insurance premiums in coastal or wildfire-prone markets have risen sharply in recent years, and a static ratio calculated at purchase will not capture those increases.
Mortgage type compounds the risk. A 30-year fixed rate locks your P&I payment for the life of the loan, which makes long-term budgeting predictable. An adjustable-rate mortgage (ARM) starts lower but resets periodically — and a 2% rate increase on a $400,000 loan adds roughly $500/month to your payment. That kind of swing can turn a technically affordable purchase into a financial strain within a few years.
Stress-test your budget: run your numbers at 1–2% above your current rate and set aside a monthly maintenance reserve before you decide a home fits your budget.
A practical buyer checklist from a San Diego agent
Before making an offer, work through these steps. This is the sequence Jeffsellssandiego walks buyers through in San Diego, where HOA fees and municipal taxes can add $400–$800/month on top of a base PITI.
- Set a comfortable monthly payment ceiling, not just a maximum. The number that lets you sleep at night is usually 10–15% below your lender's approved limit.
- Confirm post-closing cash reserves. You should have enough liquid savings to cover 3–6 months of total living expenses after your down payment and closing costs clear.
- Include every ownership cost in your monthly math: PITI, HOA fees, and a maintenance reserve. Leaving any of these out produces a number that will not survive first contact with reality.
- Get pre-approved, not just pre-qualified. Pre-qualification is a conversation; pre-approval is a verified underwriting decision that sellers take seriously.
- Check resale and rental optionality. A home that could rent for enough to cover the mortgage gives you an exit if your circumstances change — a flexibility premium worth paying for.
- Verify your DTI with your lender directly, including all recurring obligations. Lenders calculate DTI differently from the back-of-envelope version, and surprises at underwriting cost time and deals.
- Research neighborhood-specific costs. In San Diego, Mello-Roos taxes and high HOA fees in newer communities can add thousands annually — costs that won't show up in a generic affordability calculator.
Pro Tip: Prioritize liquidity. Buyers who stretch to their maximum approval and close with minimal reserves are one car repair or medical bill away from financial stress. Keep 3–6 months of non-housing reserves after closing, full stop.
Reviewing common buyer mistakes before you start shopping can save you from the most avoidable errors.
How your credit score shapes what lenders will offer you
Credit score is not just a qualification gate — it directly determines your interest rate, which determines your monthly payment, which determines how much home you can actually afford. A borrower with a 760 score and a borrower with a 680 score applying for the same $400,000 loan at the same lender will receive meaningfully different rate offers, often 0.5–1% apart. On a 30-year loan, that gap translates to tens of thousands of dollars in total interest and a noticeably different monthly payment.

Most conventional loans require a minimum score of 620, though lenders prefer 740 or higher for the best pricing. FHA loans allow scores as low as 580 with a 3.5% down payment. A thin credit history — few accounts, short history, or recent derogatory marks — can trigger manual underwriting or outright denial even when income ratios look fine.
Credit history also affects which loan products are available to you. Borrowers with strong credit histories have access to a wider range of loan types and terms, which gives them more flexibility to structure a payment that fits their budget. If your score needs work, six to twelve months of on-time payments and lower credit utilization can produce a meaningful improvement before you apply.
How fixed-rate vs. adjustable-rate mortgages affect long-term affordability
The loan type you choose is an affordability decision, not just a rate decision. A 30-year fixed-rate mortgage locks your principal and interest payment permanently. Your taxes and insurance will change over time, but the core payment stays constant — which makes it far easier to plan a long-term budget and stress-test against future income changes.
An adjustable-rate mortgage (ARM) — commonly a 5/1, 7/1, or 10/1 ARM — offers a lower initial rate for a fixed period, then adjusts annually based on a market index. The initial payment looks affordable on paper. The risk is what happens at the first adjustment. If rates have risen, your payment can jump significantly, and the 28/36 ratios you qualified under at origination may no longer hold.
ARMs can make sense in specific situations: if you plan to sell or refinance before the adjustment period, or if you expect your income to rise substantially. But using an ARM to qualify for a home you could not otherwise afford at a fixed rate is a strategy that has burned buyers in every rate cycle. The affordability calculation you run today should account for the payment at the adjusted rate, not just the teaser rate.
Key Takeaways
Home affordability is a ratio problem first and a personal finance problem second — no single rule captures both dimensions, but the 30% and 28/36 thresholds give you a reliable starting screen.
| Point | Details |
|---|---|
| HUD 30% is the policy baseline | Spending more than 30% of gross income on housing costs makes a household cost-burdened by federal definition. |
| 28/36 rule governs lender qualification | Front-end PITI must stay at or below 28%; all debt payments combined must stay at or below 36% of gross income. |
| Market indices measure area-level affordability | HOAM and NAR HAI use a 100-point breakeven threshold — below 100 means the median household cannot afford the median home. |
| PITI math is the only reliable personal test | Run the full calculation including taxes, insurance, and HOA before trusting any online estimate or lender pre-qualification figure. |
| Stress-test before you commit | Budget at 1–2% above your current rate and hold 3–6 months of non-housing reserves after closing. |
The ratio is a floor, not a ceiling
Most buyers treat the 28/36 rule as a target. I'd argue it's a floor — the minimum bar for not being reckless, not a signal that you've found the right number.
The clients I see struggle most after closing are the ones who hit 36% DTI on paper and had nothing left for the unexpected. A leaking roof, a job transition, a new child — any one of those events can turn a technically affordable home into a source of constant financial pressure. The ratio didn't lie to them. They just asked it the wrong question.
What I tell buyers in San Diego: figure out the monthly payment that lets you keep saving, keep living, and keep a cushion. Then work backward from that number to a purchase price. That sequence — payment ceiling first, price second — is the opposite of how most people shop, and it's the approach that holds up over time.
Affordability isn't a fixed point. It shifts with interest rates, life circumstances, and local costs. The math gives you a framework. Your judgment fills in the rest.
Useful sources and tools
- HUD USER — Housing Affordability Across the Country: HUD's official affordability analysis, including the Homebuyer Affordability Index methodology and cost-burden definitions.
- HUD Archives — Glossary of Affordable Housing Terms: The canonical HUD definition of affordable housing (no more than 30% of gross income).
- Atlanta Fed HOAM Explainer: How to read the Home Ownership Affordability Monitor and interpret index values above and below 100.
- Atlanta Fed HOAM Data Tool: Interactive metro-level affordability data updated regularly.
- Habitat for Humanity — What Is Housing Affordability?: Accessible summary of the 30% rule and the housing/income problem framing from Harvard's Joint Center for Housing Studies.
- Bankrate — What Is the 28/36 Rule?: Clear explanation of lender underwriting ratios and their limitations.
- Chase Mortgage Affordability Calculator: Reverse-calculate a maximum home price from income, debts, rate, and down payment.
- New American Funding — Is That Home Really Affordable?: Practitioner perspective on why ratios understate real affordability risk.
- Jeffsellssandiego — Buyer's Guide: San Diego-specific buyer resources, pre-approval guidance, and next steps.
- Jeffsellssandiego — Home Search: Browse active San Diego listings and connect with Jeff directly for personalized affordability guidance.
This article is general information, not financial or legal advice. Confirm current guidelines with HUD, your lender, or a qualified financial professional for your specific situation.