
Local market trends are the measurable shifts in supply, demand, pricing, and neighborhood dynamics that directly determine what a home is worth and when to buy or sell it. In San Diego's residential market, understanding the role of local market trends separates smart decisions from costly ones. National headlines about housing rarely reflect what is happening in North Park, Pacific Beach, or Point Loma. The forces shaping your specific neighborhood, including job growth, school ratings, infrastructure changes, and housing inventory, move independently from broader national data. This guide breaks down exactly how those forces work and how you can use them.
What key factors drive local market trends in san diego real estate?
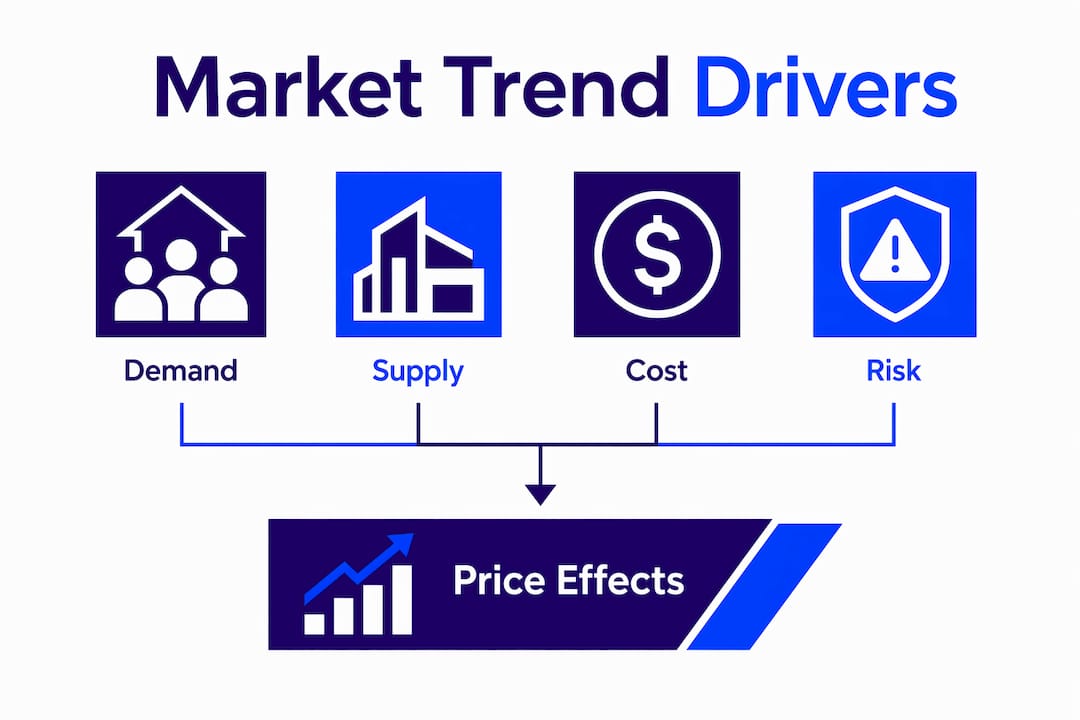
The four-factor framework of Demand, Supply, Cost, and Risk is the most reliable structure for evaluating any local real estate market. Each factor tells a different part of the story, and ignoring any one of them creates blind spots.
Demand signals are the clearest starting point. Job growth in San Diego's defense, biotech, and tourism sectors pulls new residents into specific zip codes. Housing churn, meaning the rate at which residents move, downsize, or upgrade, is actually a more accurate local demand barometer than population growth alone. A neighborhood where longtime owners are selling and younger buyers are moving in is signaling a transition worth watching.

Supply constraints shape prices just as powerfully. San Diego faces persistent zoning restrictions and limited buildable land, which keeps new construction activity low in established neighborhoods. When housing stock cannot grow to meet demand, prices rise. Areas with housing shortages see significant rental rate increases as demand outpaces supply, and the same dynamic applies to for-sale inventory.
Cost factors include mortgage rates, property taxes, and insurance. These directly affect buyer purchasing power and, by extension, how many qualified buyers compete for each listing.
Risk factors cover economic concentration and infrastructure stability. San Diego's diverse employment base across military, healthcare, and technology sectors reduces the risk of sudden demand drops from a single employer's layoffs. Diversified local employment supports sustained real estate demand over time.
- Job growth and employer diversity in the local area
- Active housing inventory levels and days on market
- New construction permits and zoning approval rates
- School district ratings and proximity to transit
- Commute friction from planned road or transit changes
Pro Tip: Monitor building permit filings and contractor density in a target neighborhood. A surge in permit activity signals developer confidence and often precedes price appreciation by 12–18 months.
How do local market trends affect property prices and sale dynamics?
Listing velocity, the speed at which homes go under contract, is one of the most reliable leading indicators of neighborhood health and upcoming price changes. When homes in a San Diego neighborhood are selling in under two weeks, that pace signals real demand before price increases appear in the data.
Here is how a local trend typically moves from early signal to price change:
- Search interest rises. Rising specificity in search behavior on neighborhood names and nearby amenities signals buyer intent moving from curiosity to commitment.
- Inventory tightens. Active listings drop as buyers absorb available homes faster than sellers list new ones.
- Days on market shrink. Homes that once sat for 45 days begin selling in 10 to 14 days.
- Multiple offers appear. Sellers receive competing bids, pushing final sale prices above list price.
- Comparable sales reset pricing. New sold comps at higher prices become the baseline for the next wave of listings.
This sequence plays out at the neighborhood level, not the city level. A trend accelerating in Mission Hills may be completely absent in Clairemont at the same time.
| Trend Indicator | Market Signal | Expected Effect on Prices |
|---|---|---|
| Days on market falling | Strong buyer demand | Upward price pressure |
| Inventory rising sharply | Buyer's market forming | Price stabilization or decline |
| Building permits surging | New supply incoming | Moderate price growth |
| Rental rates climbing fast | Ownership demand increasing | Higher sale prices follow |
| Multiple offers per listing | Competitive seller's market | Prices exceed list price |
Neighborhood-specific data consistently outperforms city-wide averages for predicting where prices move next. City-level permit and business data are more predictive than national averages for real estate outcomes. Relying on a San Diego-wide median price to evaluate a specific block in La Jolla or Logan Heights is like using a weather forecast for California to decide whether to bring an umbrella to Balboa Park.
How can buyers and sellers use local market analysis to decide smarter?
The most important decision in real estate is market selection, not property selection. A mediocre deal in a strong market outperforms a superior deal in a declining market. That principle should anchor every conversation you have about timing, pricing, or neighborhood choice in San Diego.
For buyers, the practical application starts with ranking neighborhoods by measurable signals rather than personal preference alone. Evidence-based systems that score neighborhoods by listing velocity, inventory trends, and price momentum give you an objective starting point. You can then layer in personal criteria like school quality, commute time, and walkability.
Sellers benefit from the same analysis in reverse. Knowing that your neighborhood is in the early appreciation phase, with shrinking days on market and rising search interest, tells you that waiting six months may yield a higher sale price. Knowing you are in a softening market tells you to price aggressively from day one. Jeffsellssandiego uses this kind of neighborhood pricing analysis to help sellers set prices that attract offers without leaving money on the table.
Pro Tip: Check the city's planning department website for upcoming infrastructure projects near your target neighborhood. A new transit stop or highway interchange can shift property values significantly before construction even begins.
Common mistakes buyers and sellers make when they ignore local trend data:
- Pricing a home based on what a neighbor sold for two years ago instead of current comps
- Buying in a neighborhood with rising inventory and falling list prices, assuming the market will recover quickly
- Overlooking commute friction changes from planned construction that will add 20 minutes to a daily drive
- Skipping neighborhoods with strong fundamentals because of surface-level perceptions
- Waiting for national news to confirm a local trend that has already peaked
For buyers weighing ownership against renting, the rent-versus-buy decision in San Diego depends heavily on where local prices are in their cycle, not just on current mortgage rates.
How do broader economic trends interact with san diego's local market?
Central bank policies and global inflation pressures influence borrowing costs that ripple directly into local housing markets. When the Federal Reserve raises rates, San Diego buyers face higher monthly payments, which reduces purchasing power and cools demand within a 3–6 month window. Persistent inflation with core PCE above 2% remains a primary driver of housing affordability pressure in 2026. That means buyers need to build rate sensitivity into their budget planning, not treat current rates as permanent.
Global investment patterns also shape San Diego specifically. International capital flowing into life sciences and defense technology companies here creates high-paying jobs, which drives demand for housing in neighborhoods near those employment centers. This is a regional market influence that does not show up in national housing data but shows up clearly in local price trends near Torrey Pines, Sorrento Valley, and Kearny Mesa.
Global market volatility does not always mean local economic deterioration. San Diego's diversified employment base acts as a buffer. When one sector contracts, others often hold steady, which keeps housing demand more stable than in single-industry cities.
Key macroeconomic factors to track alongside local San Diego data:
- Federal Reserve rate decisions and their effect on 30-year mortgage rates
- Core PCE inflation readings, which signal future rate direction
- Defense and biotech sector hiring trends in San Diego County
- National housing starts data, which affects builder confidence locally
- Consumer confidence indexes, which predict buyer willingness to commit
Pro Tip: Pair a macroeconomic indicator like the 10-year Treasury yield with your local days-on-market data. When Treasury yields rise sharply and local inventory is also climbing, that combination signals a buyer's market forming faster than either data point suggests alone.
Key takeaways
Local market trends in San Diego are the most reliable guide to property values and timing decisions, and reading them correctly requires neighborhood-level data, not national headlines.
| Point | Details |
|---|---|
| Use the four-factor framework | Evaluate every neighborhood by Demand, Supply, Cost, and Risk before making any decision. |
| Listing velocity predicts prices | Homes selling fast signal price increases before they appear in sold data. |
| Market selection beats property selection | A strong market makes average deals profitable; a weak market makes great deals risky. |
| Macro trends filter into local markets | Fed rate moves and inflation affect San Diego affordability within 3–6 months. |
| Local permits beat national reports | Building permit filings and planning data predict neighborhood shifts earlier than any national index. |
What i've learned after years of watching san diego markets move
Most buyers walk into a neighborhood search with a list of features they want in a home. Bedrooms, bathrooms, garage, backyard. That is the wrong starting point. The right starting point is the market itself.
I have watched buyers fall in love with a property in a neighborhood where inventory was quietly climbing and days on market were stretching out. Six months after closing, they were sitting on a home worth less than they paid. Not because the house was bad. Because the market was turning and they did not see it.
The buyers who consistently do well in San Diego are the ones who treat neighborhood selection like an investment decision. They look at listing velocity, permit activity, employer growth nearby, and infrastructure changes before they ever schedule a showing. They use data to narrow the field, then use personal preference to make the final call.
Sellers make the mirror-image mistake. They price based on what they need to net, not what the market will bear. Local trend data tells you exactly where you stand. If your neighborhood is in an early appreciation phase, you have room to price at the top of the range. If inventory is rising around you, you need to price to move.
The San Diego market is not one market. It is dozens of micro-markets moving at different speeds. Pacific Beach can be accelerating while a neighborhood three miles away is cooling. That is why neighborhood-specific trend data matters more than any city-wide statistic you will read in a news article.
My honest advice: stop reading national housing headlines as if they apply to your block. Start reading your neighborhood's permit filings, days on market, and active inventory. That is where the real signal lives.
— Jeff
Ready to put san diego market trends to work for you?
Jeffsellssandiego brings neighborhood-level market analysis to every buyer and seller conversation. Whether you are tracking the right time to list or trying to find the best neighborhood for your budget, having current data and local expertise makes the difference between a good outcome and a great one.

Browse current San Diego home listings to see what is active right now across the neighborhoods where trends are moving in your favor. If you want a deeper look at how to apply investor-grade thinking to your home search, the buyer strategies guide at Jeffsellssandiego walks through exactly how to rank neighborhoods by opportunity before you ever make an offer.
FAQ
What is the role of local market trends in home pricing?
Local market trends set the real-time context for what buyers will pay and what sellers can expect. Factors like days on market, active inventory, and listing velocity directly determine whether a home sells above, at, or below list price.
How do i track local market trends in san diego?
Monitor neighborhood-level data including active listings, days on market, recent sold prices, and building permit filings. City planning department records and local MLS data provide more accurate signals than national housing reports.
Why do san diego neighborhoods trend differently from each other?
Each neighborhood has its own employment proximity, school quality, infrastructure access, and housing stock. These local factors create independent supply and demand dynamics that move at different speeds across the city.
How do interest rates affect san diego's local housing market?
Rate increases reduce buyer purchasing power and typically cool local demand within 3–6 months. With core PCE inflation above 2% in 2026, buyers in San Diego should build rate sensitivity into their budget planning from the start.
What is listing velocity and why does it matter?
Listing velocity measures how quickly homes go under contract in a specific area. Fast contract times signal strong demand and typically precede price increases, making it one of the most useful early indicators for both buyers and sellers.